- blog
- Statistics
- Cart Abandonment Statistics 2025 | Recover Lost Sales Now

Table of Contents
Shopping online has never been easier, yet 7 out of 10 shoppers still abandon their carts without completing their purchase. If you’re an e-commerce business owner, BDR, or AE, this statistic should grab your attention—because it represents massive revenue sitting on the table, waiting to be claimed.
Cart abandonment isn’t just a metric; it’s your biggest opportunity to turn browsers into buyers and dramatically increase your bottom line. The numbers tell a story of missed connections, friction points, and most importantly, recoverable revenue that could transform your business.
Cart Abandonment Rate Overview
The average cart abandonment rate globally sits at 70.19% as of 2024, meaning that for every 100 potential customers who add items to their cart, only about 30 complete their purchase. This isn’t a small problem—it’s an industry-wide challenge that’s been steadily increasing over the past decade.
From 2014’s rate of 68.07%, we’ve seen a significant 3.11% increase over ten years, with abandonment rates now consistently hovering above the 70% mark. However, there’s hope: research shows that $260 billion worth of lost orders are recoverable through better checkout flow and design improvements.
What is Cart Abandonment?
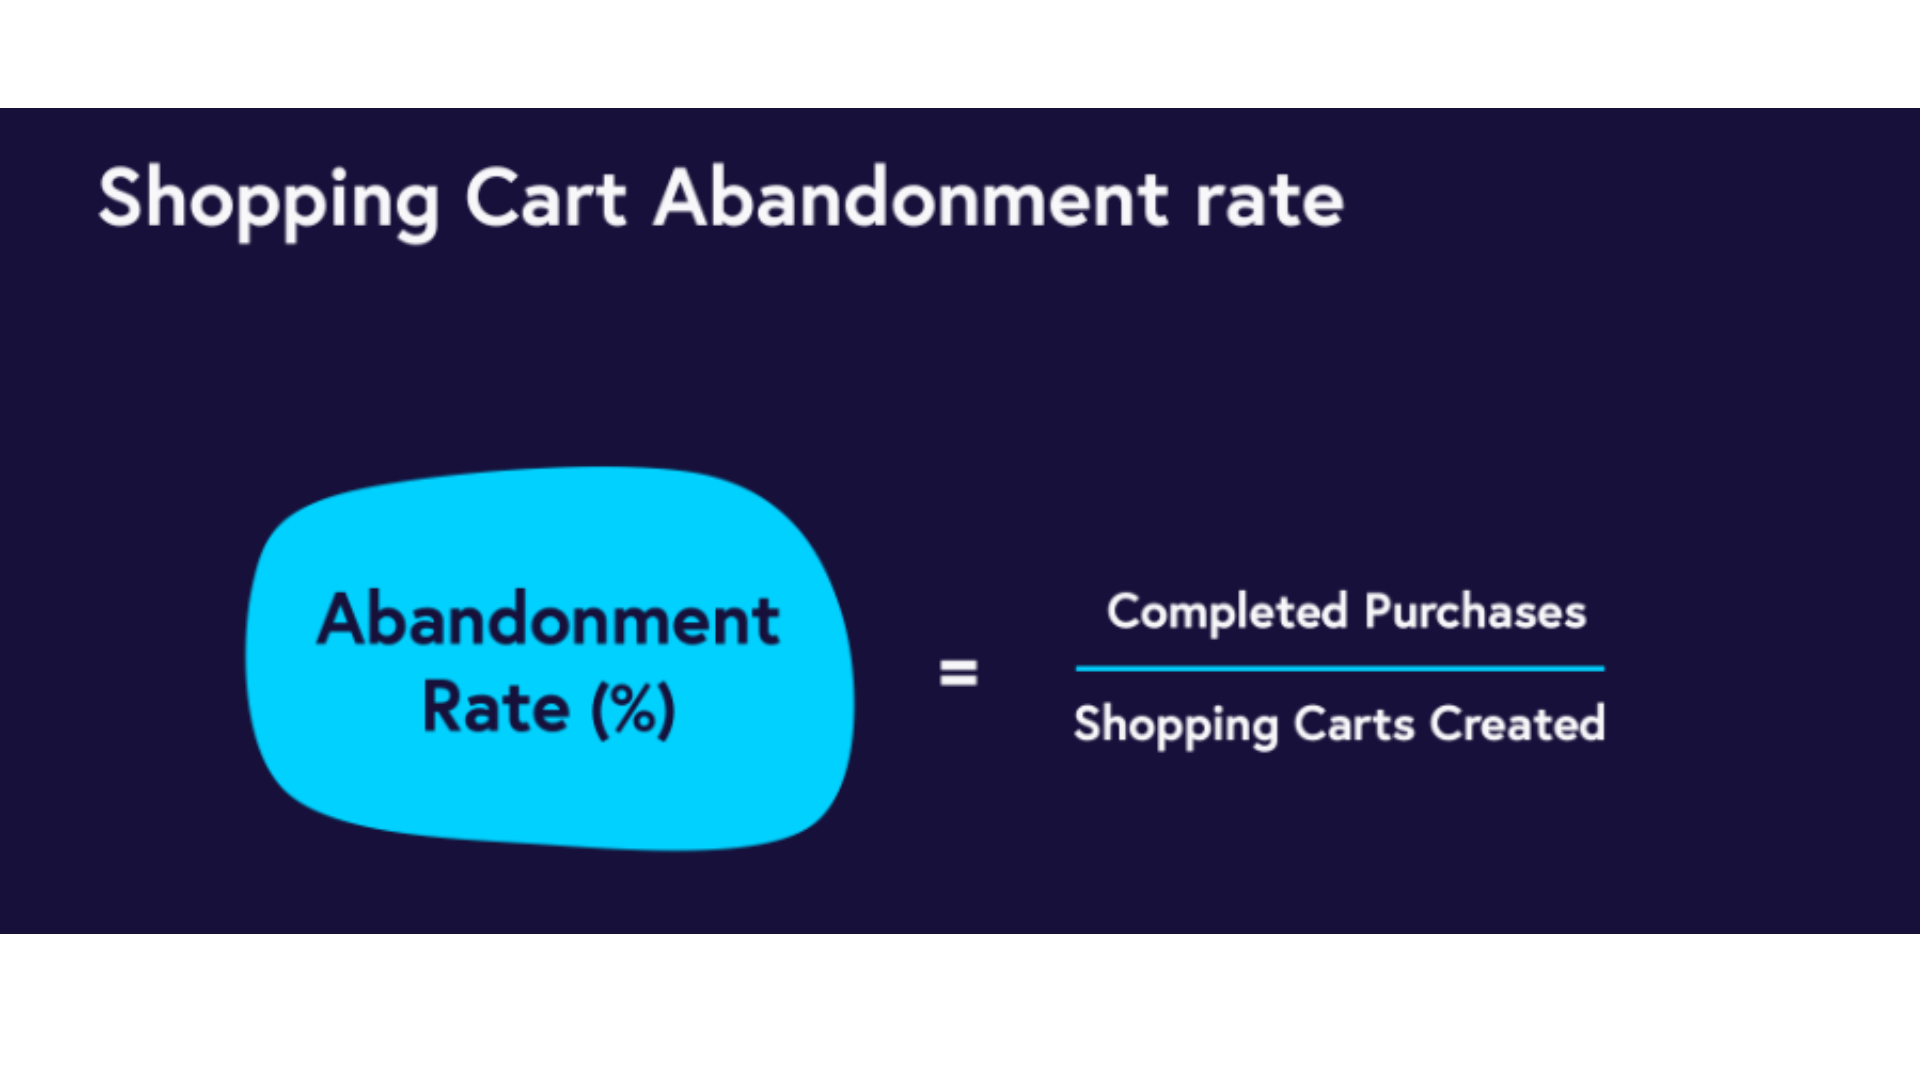
Cart abandonment occurs when a shopper adds items to their online shopping cart but leaves the website before completing the purchase. It’s calculated using this simple formula:
Cart Abandonment Rate = (1 – (Completed Purchases ÷ Shopping Carts Created)) × 100
For example, if 100 carts are created but only 30 result in purchases: (1 – (30 ÷ 100)) × 100 = 70% abandonment rate
The Hidden Cost of “Just Browsing”
While 43% of US online shoppers abandon carts because they’re “just browsing” or not ready to buy, the remaining 57% represent genuine friction points that businesses can address. This means more than half of your cart abandonment is fixable.
> “Transform your cold outreach strategy while you optimize your cart recovery. Salesso helps you find verified email addresses and warm up your email campaigns to re-engage those abandoned cart prospects. Start Free Trial“
Cart Abandonment Rates on Different Devices
Device performance tells a crucial story about where your biggest opportunities lie. The data reveals stark differences in how customers behave across platforms.
Mobile: The Abandonment Leader
Mobile devices consistently show the highest abandonment rates, ranging from 69% to 85.7%. This presents both a challenge and opportunity, considering that mobile traffic accounts for over 58% of all e-commerce sessions.
Key mobile statistics:
- Mobile abandonment rate: 69-86%
- Mobile traffic share: 58%+ of e-commerce sessions
- Main mobile issue: 39% of users struggle with small screen navigation and data entry
Desktop: Still the Conversion Champion
Desktop computers maintain lower abandonment rates, typically between 62-73%. The larger screen real estate and easier navigation make completing purchases feel less cumbersome.
Tablets: The Middle Ground
Tablets fall between mobile and desktop with abandonment rates around 68-81%, though they represent only about 3% of total e-commerce traffic.
Device Comparison Table:
Device | Abandonment Rate | Traffic Share | Key Challenge |
Mobile | 69-86% | 58%+ | Small screen friction |
Desktop | 62-73% | ~35% | Legacy platform |
Tablet | 68-81% | ~3% | Limited optimization |
The “Mobile Paradox” is clear: customers browse on mobile but struggle to convert on the same device. This gap represents your biggest conversion opportunity.
Cart Abandonment Rates from Different Angles
Understanding abandonment patterns across industries, regions, and demographics helps you benchmark your performance and identify specific improvement areas.
Industry Breakdown: Who Struggles Most?
Different industries face unique abandonment challenges based on purchase complexity, price points, and customer behavior patterns.
Highest Abandonment Industries:
- Fashion & Apparel: 84.56%
- Finance Products: 83.6%
- Luxury & Jewelry: 81-88%
- Travel Bookings: 81.7%
Lowest Abandonment Industries:
- Consumer Electronics: 50%
- Pet Care & Veterinary: 54.8%
- Food & Beverage: 63.6%
Regional Variations: Geography Matters
Cart abandonment varies significantly by region, with Asia-Pacific leading at 80.52%, Europe at 79.28%, and the Americas at 71.8%. These differences reflect local payment preferences, shipping expectations, and cultural shopping behaviors.
Traffic Source Impact
Social media traffic shows the highest abandonment rates at 89-91%, while search engine traffic (organic/paid) performs best at 75-76%. This highlights the importance of matching your recovery strategy to traffic source intent levels.
🚀 Supercharge Your E-commerce Recovery
Turn abandoned carts into loyal customers with targeted email campaigns
Salesso’s email verification ensures your recovery messages reach real prospects
Get Started
Causes of Cart Abandonment
Understanding why customers abandon their carts is the first step to fixing the problem. The data reveals clear patterns that smart businesses can address.
The Big 5: Primary Abandonment Triggers
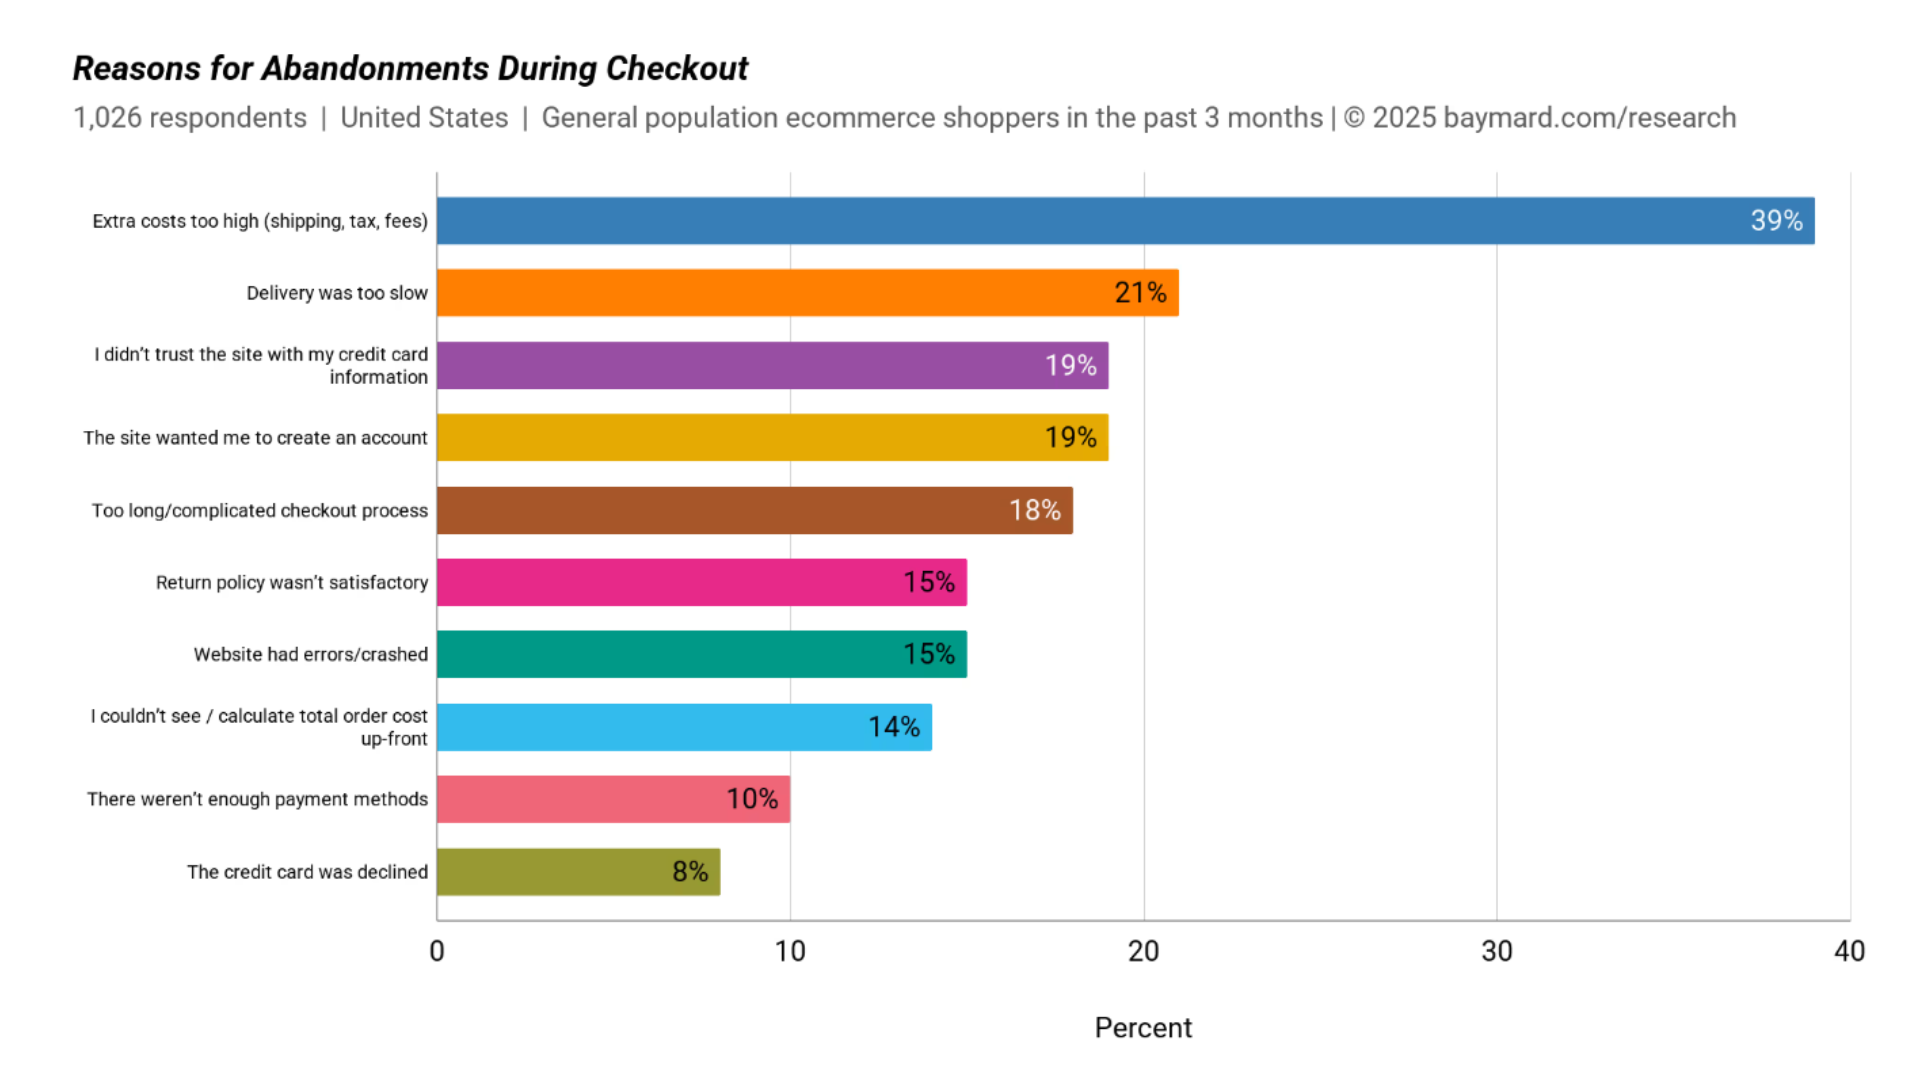
- Unexpected Costs (48% of abandoners) Nearly half of all cart abandonment occurs when shoppers encounter surprise shipping fees, taxes, or additional charges during checkout. Transparency is crucial—hidden costs destroy trust instantly.
- Forced Account Creation (25% of abandoners) One in four shoppers will abandon rather than create an account. Guest checkout options are no longer optional—they’re essential for conversion.
- Slow Delivery Times (23% of abandoners) In our instant-gratification economy, 23% of customers abandon when delivery seems too slow. Clear delivery expectations set upfront can prevent this friction.
- Complex Checkout Process (22% of abandoners) Long checkouts with too many steps cause 22% of abandonments. The ideal checkout should have 3 steps maximum, compared to the typical 5+ steps most sites use.
- Security Concerns (19-25% of abandoners) 17% of people don’t trust sites with their credit card information. Trust signals and security badges aren’t just nice-to-have—they’re conversion necessities.
Additional Friction Points
- Broken discount codes: 46% abandon when promo codes don’t work
- Website speed: 90% abandon if the site is too slow
- Re-entering information: 55% abandon if forced to re-enter credit card or shipping details
- Limited payment options: 13% abandon due to insufficient payment methods
The Trust and Effort Economy
Most abandonment boils down to two core issues:
- Trust Tax: Customers penalize sites that feel opaque, insecure, or deceptive
- Effort Economy: Shoppers have limited patience for complex, time-consuming processes
Address these fundamental issues, and you’ll see immediate improvement in your abandonment rates.
Lost Revenue Due to Cart Abandonment
The financial impact of cart abandonment extends far beyond individual lost sales—it compounds over time and affects your entire business ecosystem.
The Global Impact
E-commerce businesses lose approximately $18 billion in sales revenue annually due to cart abandonment. Even more staggering, some analyses suggest the total value of abandoned merchandise could reach $4 trillion annually.
Calculate Your Lost Revenue
Here’s a simple way to estimate your potential lost revenue:
Formula: Current Annual Revenue ÷ (1 – Cart Abandonment Rate) – Current Annual Revenue
Example: If you generate $1,000,000 annually with a 70% abandonment rate:
- Total cart value created: $1,000,000 ÷ 0.30 = $3,333,333
- Lost revenue: $2,333,333
- Recoverable with 10% improvement: $233,333
Hidden Costs Beyond Lost Sales
Cart abandonment creates ripple effects throughout your business:
- Increased customer acquisition cost: Marketing spend yields no return
- Damaged customer relationships: Poor experiences discourage future purchases
- Competitive disadvantage: 26% of cart abandoners buy from competitors instead
- Reduced customer lifetime value: Lost first-time buyers mean no repeat business
⚡ Ready to Recover Lost Revenue?
Salesso helps you reconnect with prospects who showed purchase intent
Find their verified emails and launch targeted recovery campaigns
Start Recovery
Cart Abandonment Recovery
The good news? A significant portion of abandoned carts are recoverable through strategic interventions. The data shows impressive results for businesses that implement proper recovery tactics.
Email Recovery: Your Primary Weapon
Cart abandonment emails consistently deliver exceptional performance:
Key Email Performance Metrics:
- Open Rate: 39-51%
- Click-Through Rate: 21-23%
- Conversion Rate: 10.7%
- Revenue Recovery: Up to 10% of lost sales
Email Sequence Power: Campaigns using three emails generate $24.9 million in revenue compared to $3.8 million from single-email campaigns.
The Perfect Email Sequence
Email 1 (1-4 hours post-abandonment):
- Gentle reminder with product images
- Conversion rate: 16% when sent within first hour
Email 2 (12-48 hours post-abandonment):
- Social proof and urgency elements
- Address common concerns
Email 3 (3+ days post-abandonment):
- Discount incentives boost conversion by 20-25%
- Alternative product recommendations
Best Practices for Recovery Emails
- Timing is critical: First-hour emails boost recovery by 20%
- Personalization works: Product recommendations increase CTR by 7.2%
- Subject lines matter: Create urgency without being pushy
- Mobile optimization: Ensure emails render perfectly on all devices
- Clear CTAs: Make the path back to checkout obvious
Beyond Email: Multi-Channel Recovery
SMS Recovery: SMS messages achieve 50% open rates and 10% click-through rates, with messages opened within 90 seconds compared to 90 minutes for emails.
Exit-Intent Popups: Cart abandonment popups achieve 17.12% average conversion rates, capturing nearly 2 out of 10 abandoning visitors.
Retargeting Ads: Retargeting campaigns can bring back up to 26% of abandoners, with personalized ads generating up to 1300% ROI.
Push Notifications: Push notifications show subscription rates between 0.5-15% depending on industry, offering an underutilized recovery channel.
On-Site Optimization Strategies
Checkout Improvements:
- One-page checkout reduces abandonment by 21.8-35%
- Guest checkout can reduce abandonment by 30-41%
- BNPL options improve conversion by 78%
Trust Building:
- Display security badges prominently
- Show customer reviews and ratings
- Provide clear return policies
- Offer multiple payment methods
Recovery Success Metrics
Acceptable Recovery Rates: 10-20% of abandoned carts should be recoverable. High-performing businesses in impulse-purchase categories like fashion or food delivery can achieve 25%+ recovery rates.
Combined Strategy Results: By combining emails with popups, businesses can save up to 27.62% of cart abandoners—roughly 3 out of 10 customers.
💡 Maximize Your Recovery Potential
Connect cart abandonment insights with powerful email outreach
Salesso’s verified email database reaches your target prospects effectively
Boost Recovery
Key Takeaways for Business Success
Cart abandonment statistics reveal both the challenge and the opportunity facing e-commerce businesses today. With 70% of carts abandoned globally, the scale of lost revenue is massive—but so is the potential for recovery.
Action Items for Immediate Impact
Quick Wins:
- Implement guest checkout to eliminate 25% of abandonment triggers
- Display all costs upfront to prevent 48% of cost-related abandonment
- Optimize mobile experience to capture the largest traffic segment
- Launch basic email recovery to reclaim 10% of lost sales immediately
Strategic Improvements:
- Build multi-channel recovery systems combining email, SMS, and retargeting
- Streamline checkout to 3 steps maximum to reduce process abandonment
- Add trust signals and security badges to address confidence concerns
- Offer multiple payment options including BNPL to meet diverse preferences
The Recovery Opportunity
Remember: $260 billion in abandoned orders are recoverable through better checkout experiences and recovery strategies. Even modest improvements can yield significant revenue increases.
The businesses that thrive will be those that view cart abandonment not as an inevitable loss, but as their biggest growth opportunity. Every abandoned cart represents a warm lead who already showed purchase intent—your job is simply to remove the friction preventing them from completing their journey.
Frequently Asked Questions
What is a good cart abandonment rate?
What causes the highest cart abandonment?
How effective are cart abandonment emails?
Which devices have the highest abandonment rates?
What percentage of abandoned carts can be recovered?
How quickly should I send cart abandonment emails?

Find Quality Leads in Just One Click
Install SalesSo’s Chrome Extension and start collecting leads while you browse your favorite sites
